Getting started with NDepend 3
Oct 7, 2010 ·
I have finally got my thumb out and added an NDepend project to one of my hobby project solution, to get some analyzing done. Let’s have a look!
The first thing that hit me was how easy it is to attach NDepend to a .NET solution.
I just had to:
- Install Visual NDepend.
- Open my .NET Extensions solution.
- In the new “NDepend” menu, select “Attach new NDepend project to solution”.
- Select all projects of interested (I chose all of them).
- Press OK.
Once NDepend is added to your solution, the menu will change to look like this:
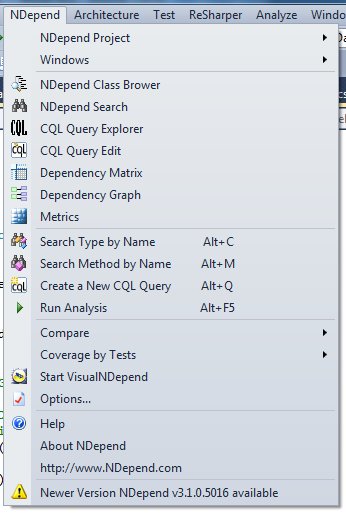
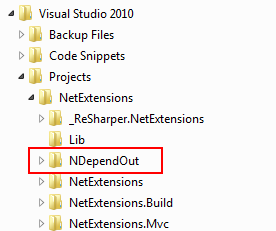
NDepend will automatically perform a first-time analysis of all projects, then launch your default browser to show an summary that is saved in NDependOut:
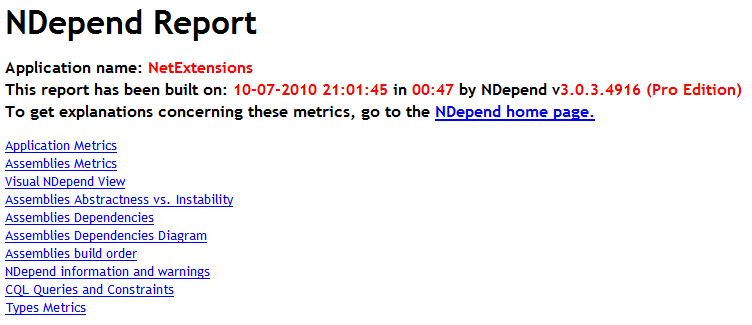
The report is divided into sections:
Let’s go through some of these sections.
Application metrics
Application Metrics contains a complete textual summary of all application metrics:
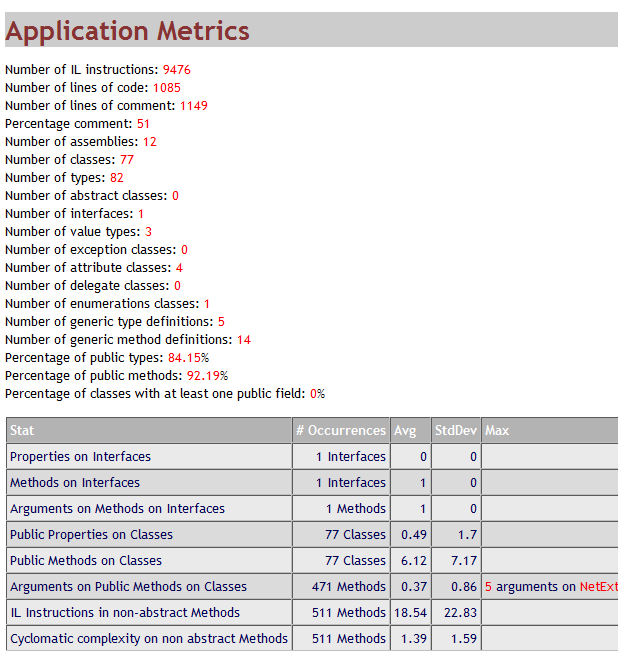
This summary contains many interesting metrics. For instance, notice the 51% comment ratio. I take great pride in commenting my code, so what’s up with that?
Actually, since the analyzed solution mainly contains of extension classes, and I don’t add comments to plain properties, that value is about what I expected.
In this solution, almost everything is public, in many cases for test purposes. This should be fixed, by letting the tests access internal parts of the solution.
The last row displays the method/function with the worst cyclomatic complexity:

However, the Visual Studio analyzer says that the cyclomatic complexity is 13! Turns out that NDepend displays the ILCC, which is the Intermediate Language Code Complexity.
Assembly metrics + abstraction/stability summary
After the application metrics come some assembly metrics (also quite interesting) as well as information about for the stability of the different assemblies, presented in a nice grid:
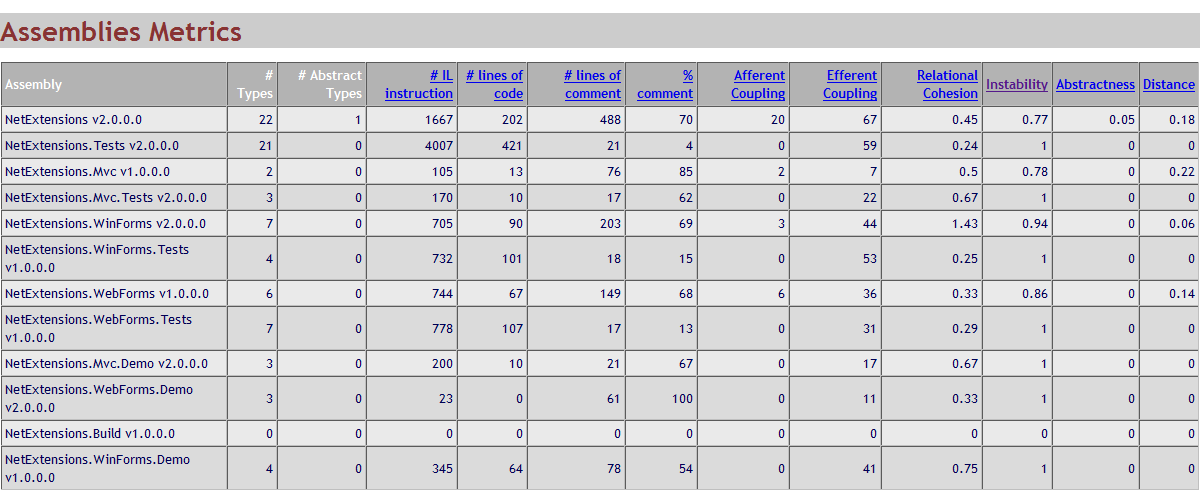
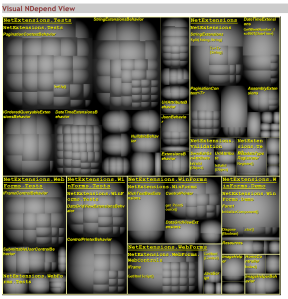
This info is then displayed in various graphical components, such as the Visual NDepend view (in Visual Studio, you can use NDepend to navigate this view):
…as well as the Abstractness vs. Instability view…
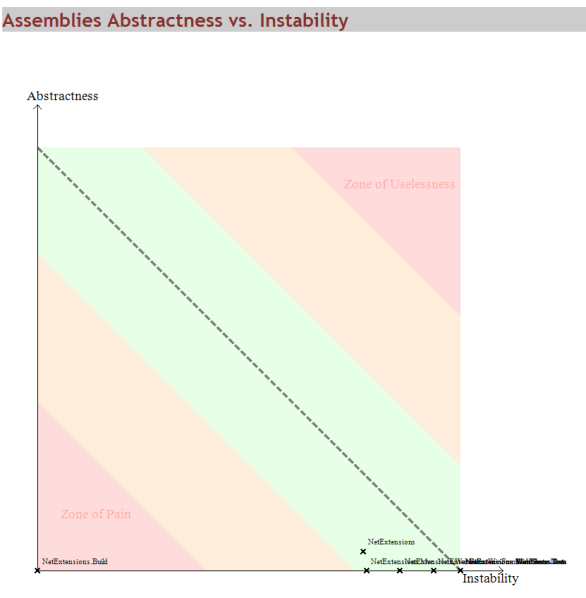
Let’s stop for a moment and discuss this graph. The word “instability” first made me feel like I had written the worst piece of junk ever, but the word is quite misleading.
Since the solution has many class extensions, which always depend on other classes, the “instability” increases since the solution highly depends on other components.
However, for this kind of solution, it is hard to have it any other way. After a bit of reflecting over the graph, it still gave me some insights to what view is meant to display.
Dependencies, build order etc.
The part of the report is probably a lot more interesting if you intend to delve into a solution of which development you have not been a part of earlier on.
However, for this particular solution, this didn’t give me anything that I didn’t already know.
Constraints
NDepend also has an amazing section where code is evaluated according to constraints:
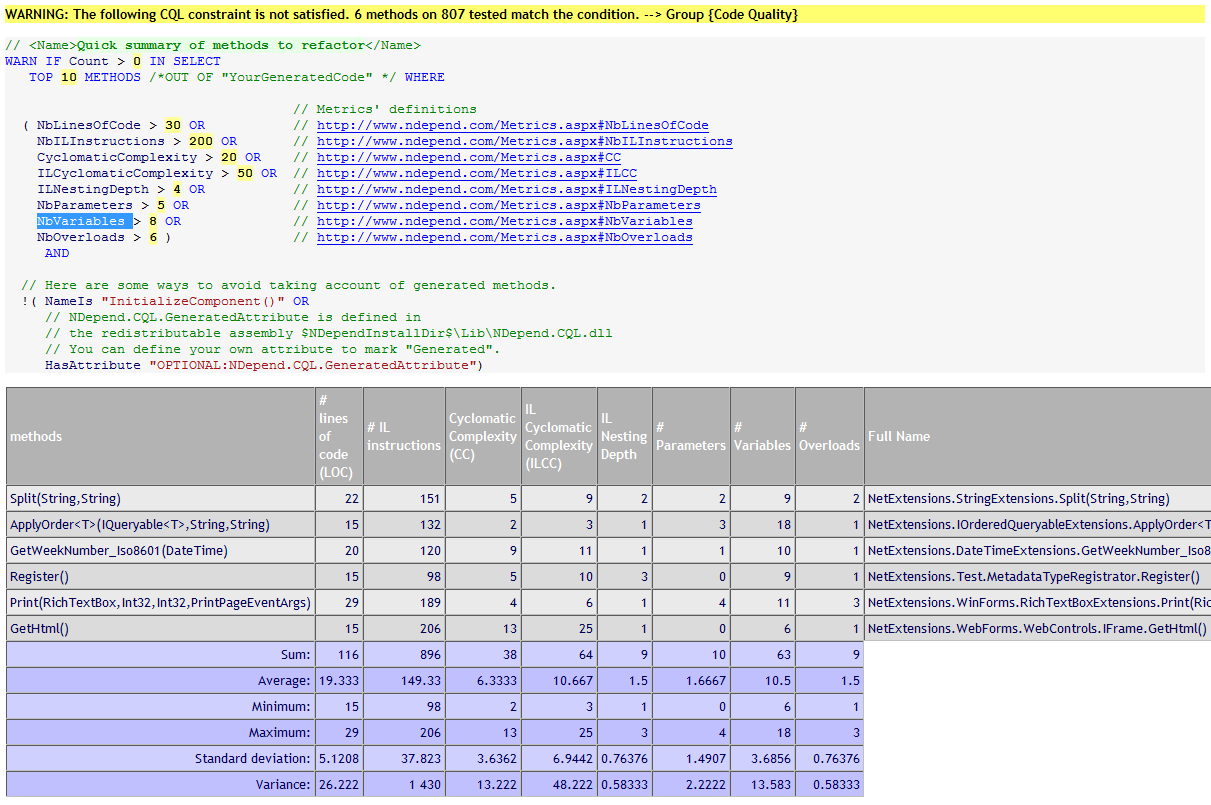
This image displays a constraint that selects all functions that:
- Has more than 30 lines of code OR
- Has more than 200 IL instructions OR
- Has a cyclomatic complexity over 20 OR
- Has an IL cyclomatic complexity over 50 OR
- Has an IL nesting depth that is larger than 4 OR
- Has more than 5 parameters OR
- Has more than 8 variables OR
- Has more than 6 overloads
For instance, the first item in the list (Split) is there because it has more than 8 variables.
Many default constraints are a bit strict, but most are very useful. Having a look at how the code applies to them, gives you a deeper understanding of the code you write.
Type metrics
Finally comes an exhausting, thorough grid, with ALL the information you can ask for about every single type in the solution. Get ready for Types Metrics.
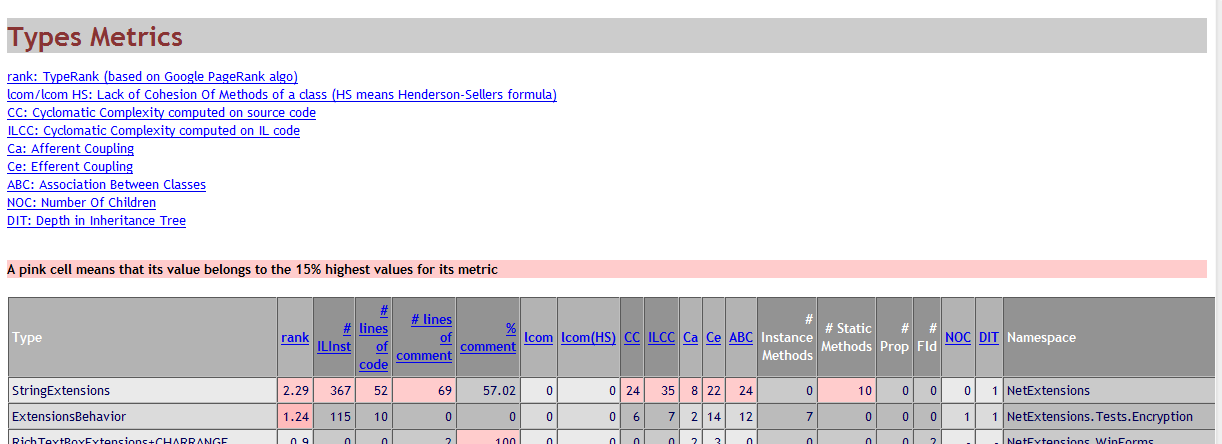
The “worst” metrics in each category are highlighted, which makes it easy to get a quick overview of the entire framework (although the information is massive).
Conclusion
I have barely scratched the surface of what NDepend has to offer, but to be able to extract all this data by just pressing a button, is quite impressive.
I first didn’t understand some parts of the report and believed that a hobby project like mine may not be the best in which to use NDepend, that it comes to better use at work.
However, after some time with NDepend, I see the benefits even for smaller projects. I can use the information I get to improve my code and watch my implementation grow better.
Discussions & More
If you found this interesting, please share your thoughts on Bluesky and Mastodon. Make sure to follow to be notified when new content is published.